Boxologies#
With the use cases identified, the next step is to draft the data shapes. These data shapes eventually will be expressed in the Shape Expression language (ShEx). However, ShEx is more geared towards users with a computer science background or requires a steep learning curve for users with a domain science background. As was stated in the previous chapter, domain experts are essential contributors to the development of data shapes.
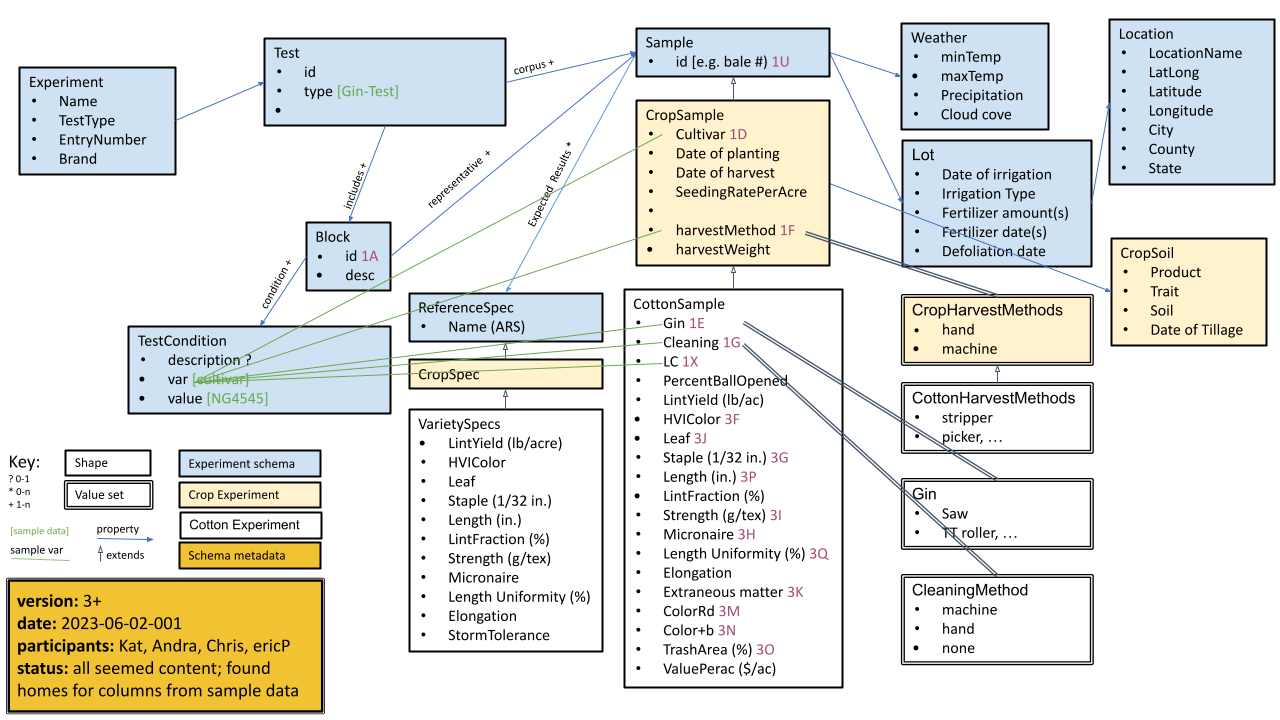
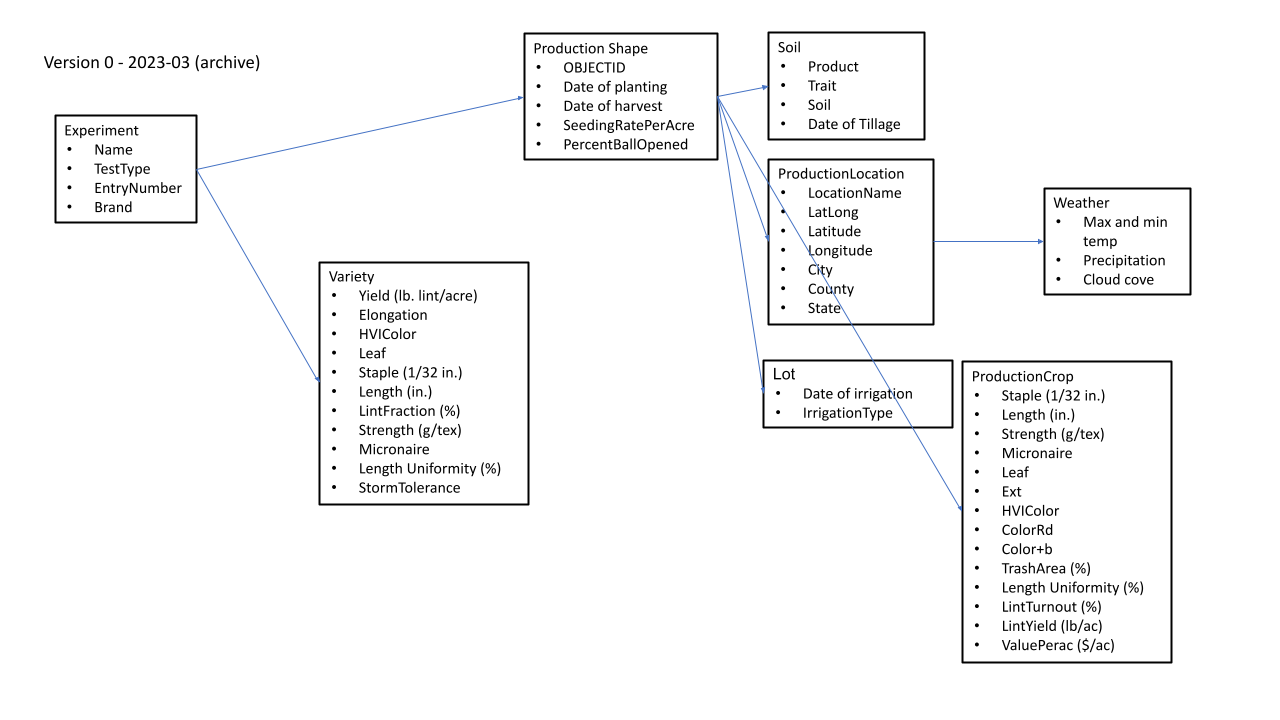
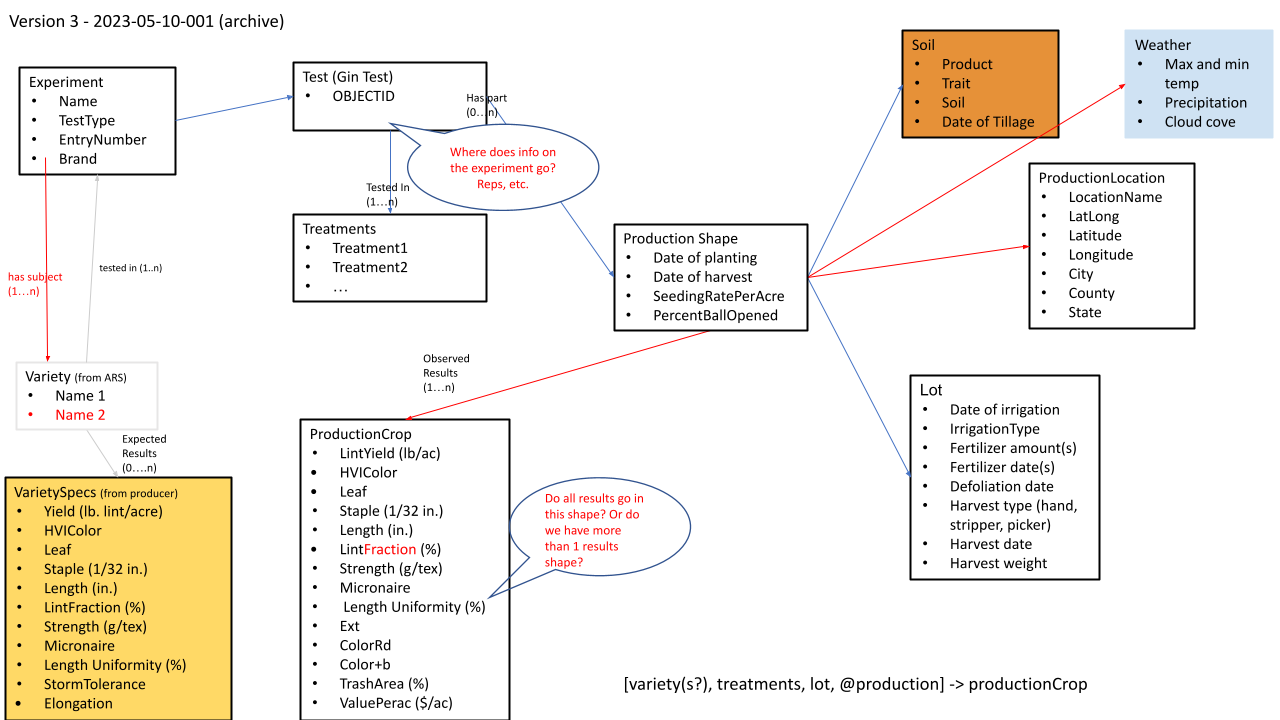
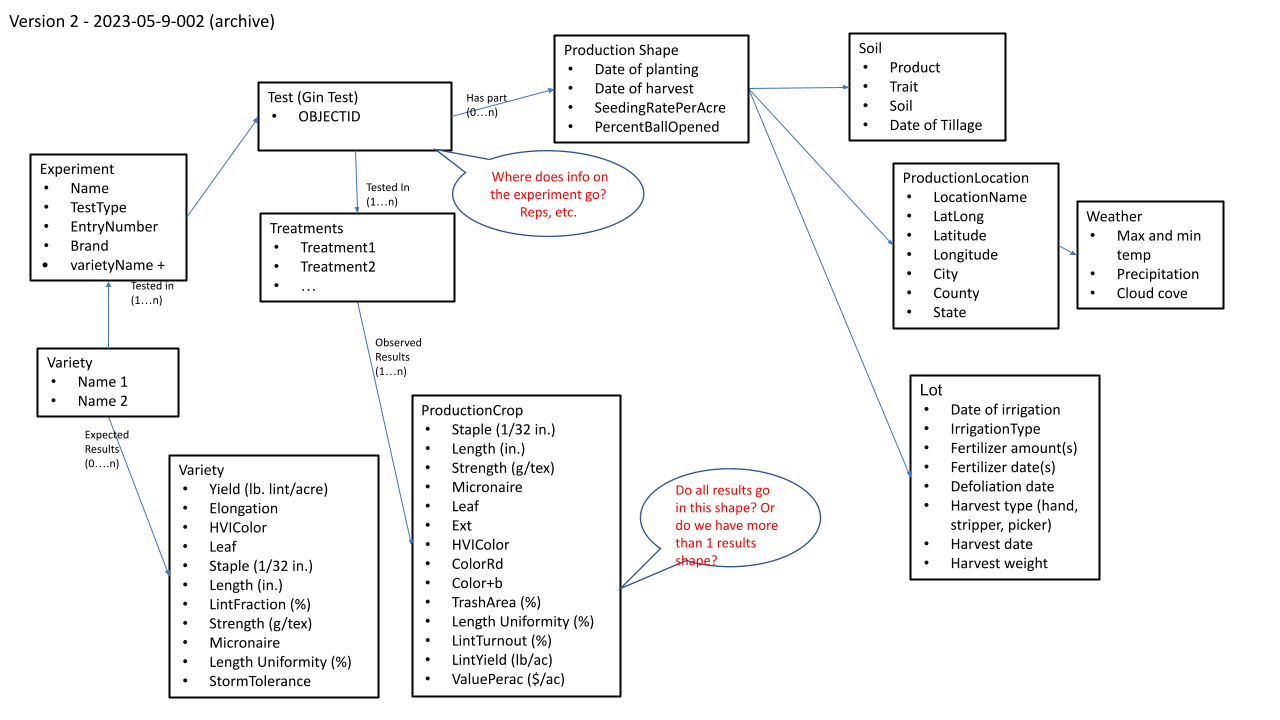
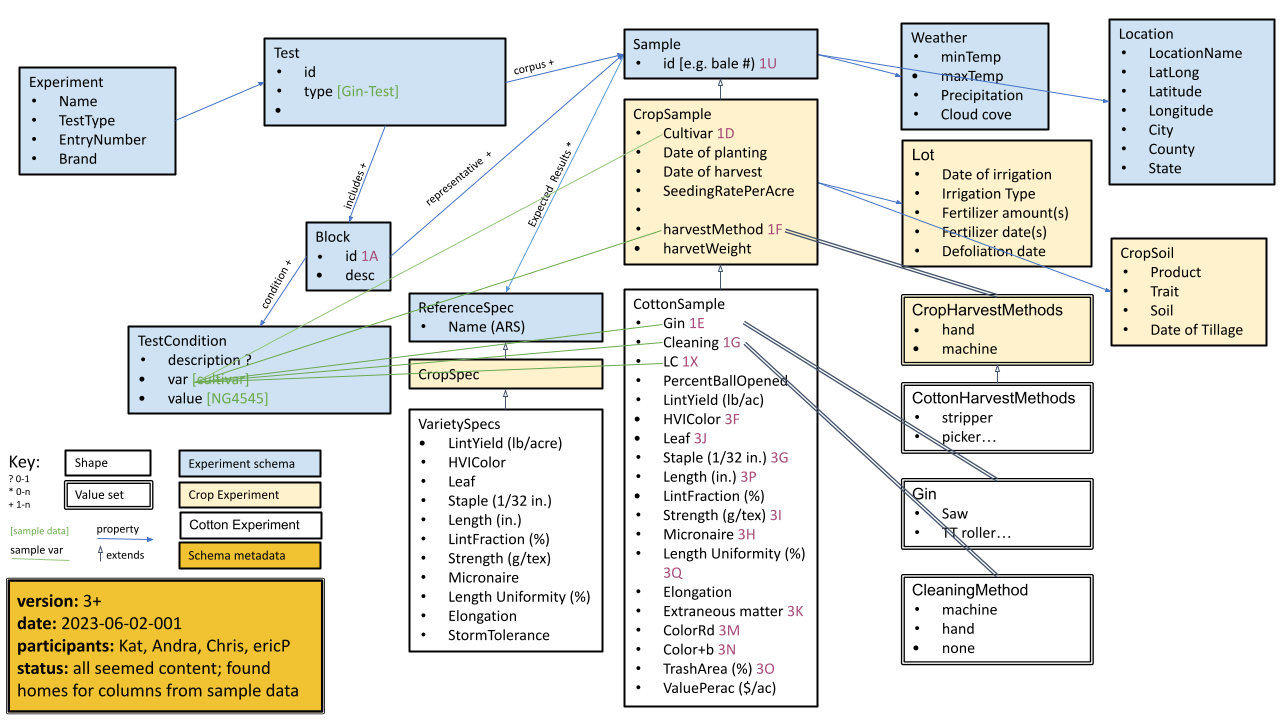
To overcome the initial distraction of the ShEx syntax and its steep learning curve, we have resorted to use a more intuitive way of capturing and expressing the data shapes. We are using what is called a Boxology. A boxology is a graphical representation of the data shapes. Where there is much room of creative freedom for the domain experts to express their expectations on the data. A boxology is based on flow charts with boxes representing proposed properties and arrows and lines connecting these boxes. While very rudimentary in nature, the boxology provides a very intuitive way to express the data shapes. Often just a white board suffice to draft a boxology. Below is an example of the boxology drafted in the earlier mentioned example on cotton, weather and soil data.
The figures below were drafted in regular online meetings, using a mix of available drawing tools.

